Runs summarizes evaluation suite executions. It combines lifecycle state, quality outcomes, operational metrics, dataset context, and trace coverage.
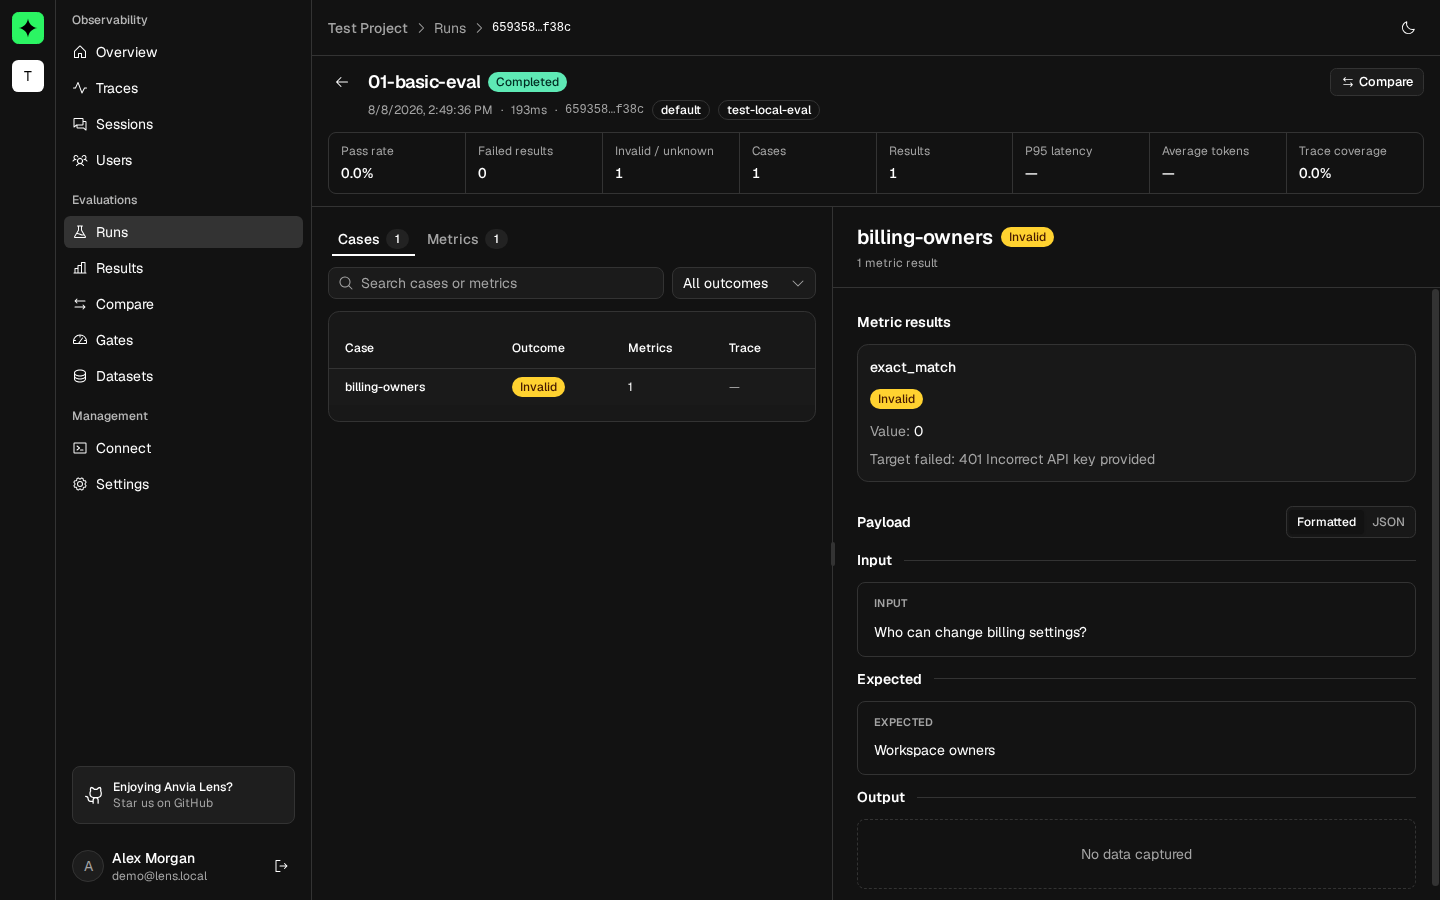
Example: inspect the support run
Run pnpm example:anvia:eval, then open Evaluations → Runs and search for
support-policy-regression. Open the newest completed row.
Start with the policy-fact-present pass rate, then select the refund-window case. Compare its
captured question, expected 30 days, actual response, and evaluator outcome. Follow the trace link
to confirm which model call produced the answer.
Expected result: the run contains three cases, one result per case, dataset context
support-policy-cases@v1, and a trace for every evaluated agent call. A failed fact remains a failed
result even though the run itself is completed.
Understand run status
- Running means Lens has received the start event but no terminal lifecycle event.
- Completed means the suite reported successful completion, even when individual results fail.
- Failed means the suite itself reported a terminal failure.
A completed run is not automatically a release approval. Release text is metadata sent by the evaluation instrumentation; a missing value is shown as Unreleased.
Find a run
Search by full run ID, suite, or release. Filter by status, suite, environment, release, and time range. Sort supported columns, change pagination, and choose a refresh interval while a suite is active.
The run table reports date, full run ID, suite, status, environment, release, cases, result counts, pass rate, P95 latency, average tokens, trace coverage, and dataset context where available.
Use the evaluation overview
Open the overview from the Runs page for aggregate result count, pass rate, failures, evaluated traces, quality trend, metric breakdown, and suite breakdown. It follows the current range, suite, environment, and release filters.
Compare selected runs
Select exactly two completed runs with the same suite and environment. From the Runs table, Lens assigns the older run as baseline and the newer run as candidate, then opens Compare.
Running, failed, or incompatible runs cannot be selected together. You can also choose candidate and baseline manually on the Compare page.
Inspect run detail
Open a run to review:
- Pass rate, failed results, invalid or unknown results, cases, and result count.
- P95 trace latency, average total tokens, and trace coverage.
- Suite, service, environment, release, dataset, timestamps, and run metadata.
- Every case and its metric results, outcome, value, explanation, and related trace.
Search cases or metrics and filter case outcome. Select a case to open its input, expected output, actual output, context, retrieval context, metric results, and trace link.
Payload sections may be unavailable when capture was disabled, redacted, expired, or incomplete. The quality result remains visible even when the underlying payload is unavailable.