A trace represents one end-to-end application operation. The trace explorer is the primary place to move from a broad production signal to the exact agent run that caused it.
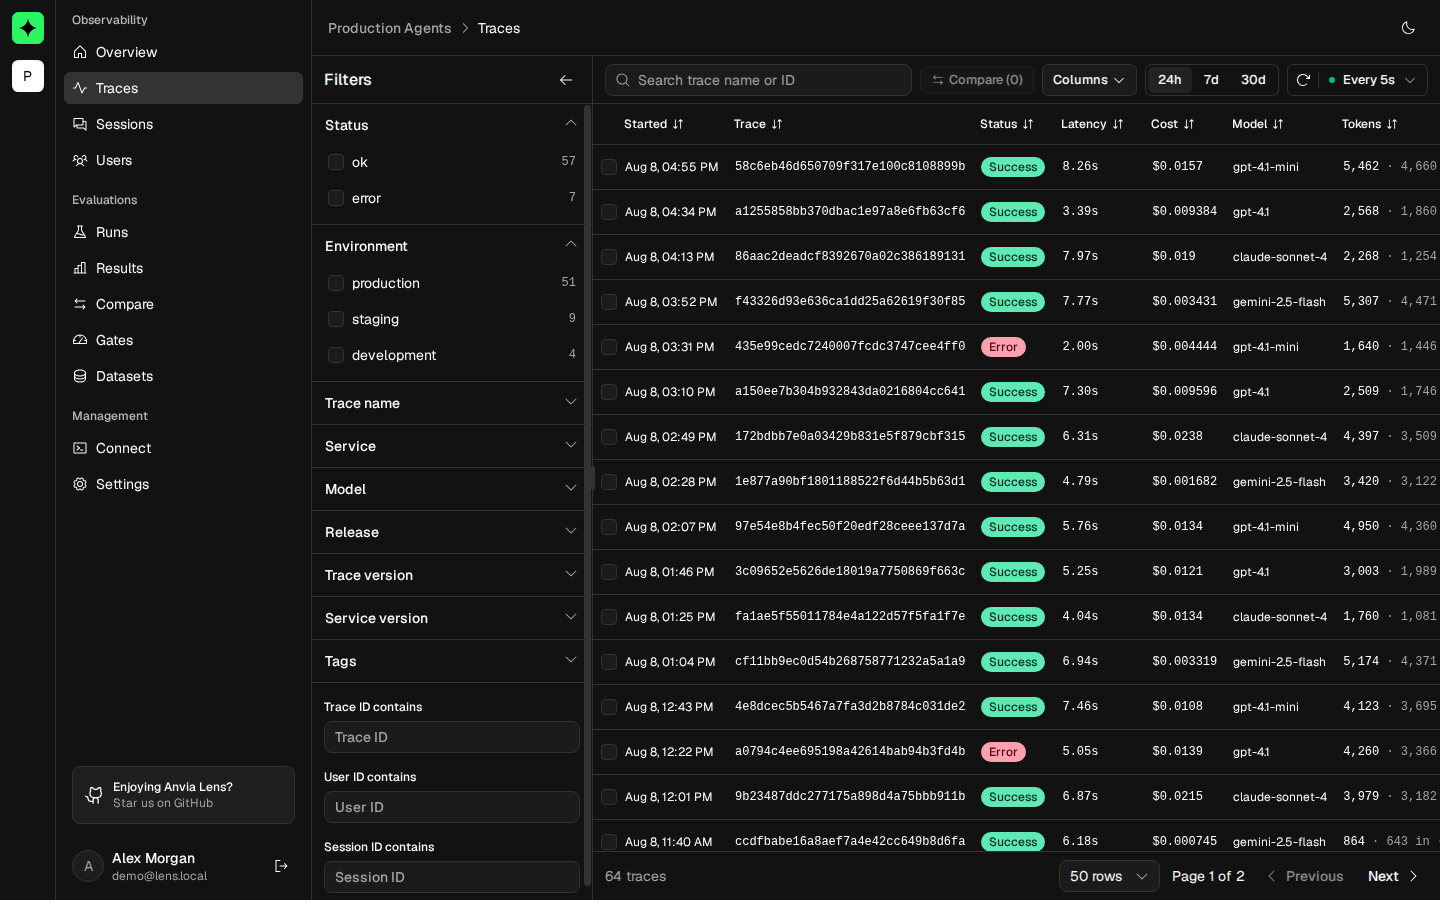
Example: locate a tool-heavy support request
From a configured source checkout, run:
pnpm example:anvia:toolsOpen Traces, keep the range at 24h, and search for ticket-triage. Add the
lens-example tag filter if the project also contains production traffic. Keep Duration,
Tokens, Cost, and Status visible while comparing matching rows.
Expected result: a successful ticket-triage trace appears with an agent, model generation, and
get_ticket tool observation. Its full trace ID matches the ID printed by the command. Open it to
continue the investigation in Trace details.
Search and time range
Search by trace name or full trace ID. Choose a preset time range, then use the refresh control when monitoring recent activity. Search and filters are reflected in the URL so an investigation can be bookmarked or shared with another workspace member.
Filter traces
Open the filter panel to combine dimensions:
- Status, environment, trace name, service, model, and release.
- Trace version, service version, and tags.
- Trace ID, user ID, or session ID containing a supplied value.
- Minimum and maximum duration, token count, or cost.
Facet counts are calculated for the current query. Multiple values inside one dimension broaden that dimension; filters from different dimensions narrow the result together.
For example, selecting production and staging within Environment includes either
environment. Adding Status: Error then keeps only failed traces from those environments.
Sort and choose columns
Sort from a supported table heading and change the row count with the pagination control. Use the column chooser to keep identifiers, context, latency, tokens, and cost appropriate to the current investigation.
Trace IDs are displayed in full and can be used to correlate Lens with application logs or another OpenTelemetry backend.
Compare traces
Select at least two rows and choose Compare. Lens opens the selected traces side by side with their status, duration, span count, token usage, cost, and complete span navigation.
Trace comparison is visual inspection rather than an evaluation-run comparison. Use it for two production requests; use Compare evaluation runs for aggregate metric and case-level regression analysis.
Open a trace
Select a row to open the trace detail route. The next guide explains the span tree, timeline, payloads, and trace navigation in Trace details.
Empty results
If the project has telemetry but the table is empty, clear active filters, widen the time range, and refresh. If the project has never received a trace, verify the integration through Troubleshooting.