The project overview is the fastest way to establish whether activity, errors, latency, tokens, or cost changed before opening individual traces.
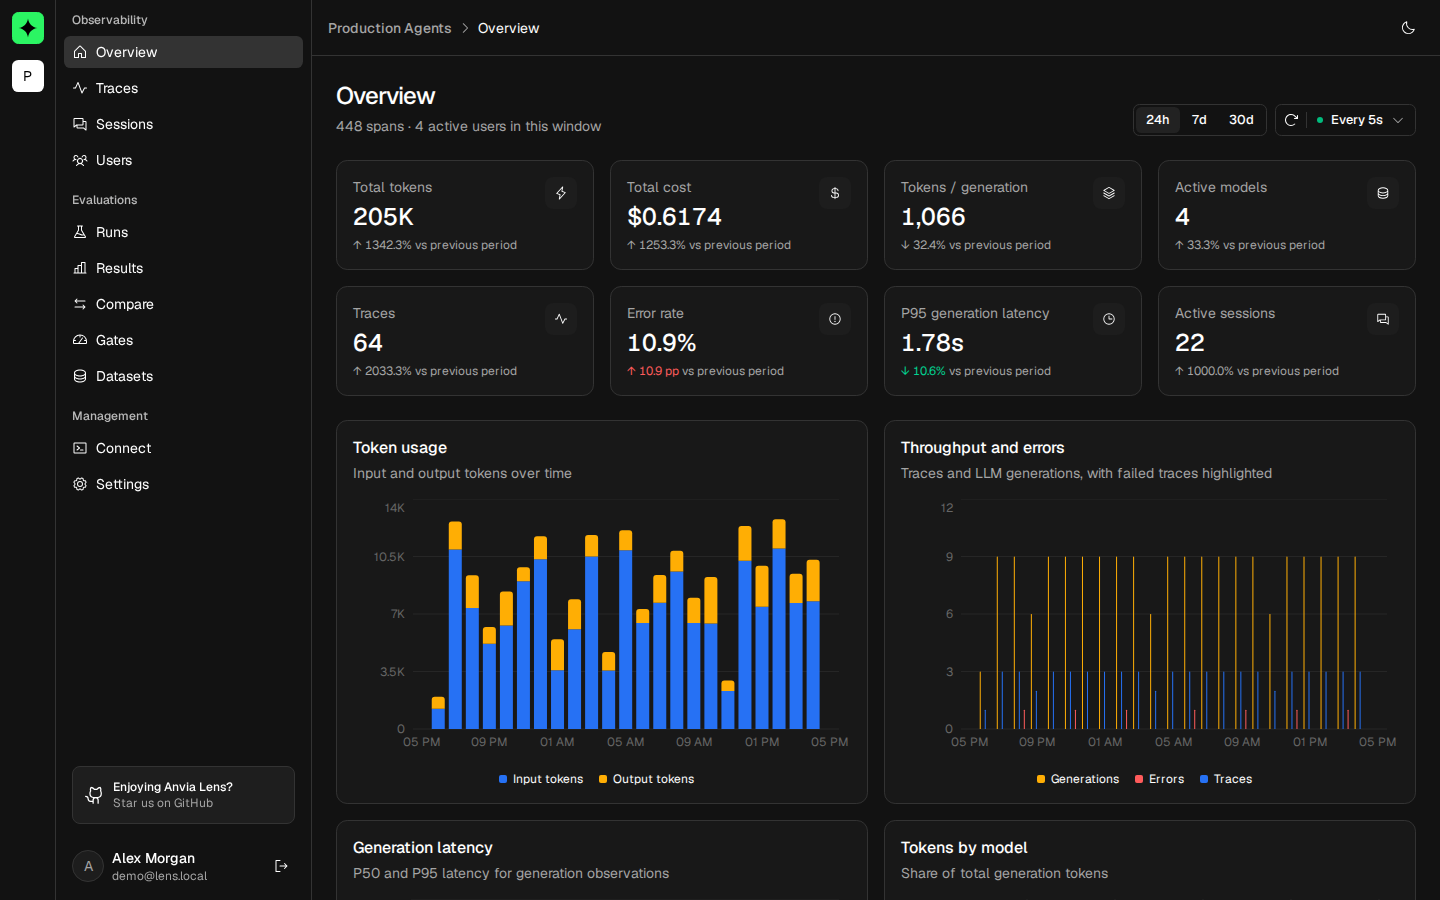
Example: find where a slowdown started
Suppose support-agent latency increased after a release. Select 24h and compare P95 generation latency with the previous 24 hours. Find the point where the latency chart rises, then check the service and model breakdowns for the same window. Open a slow trace from the ranking to continue at request level.
For a populated local workspace, load the development seed data from a source checkout:
docker compose -f docker-compose.dev.yml run --rm seedExpected result: the overview shows non-empty trace, token, error, latency, session, service, and model summaries. Moving to Traces keeps the investigation focused on the selected project; use the same time range when narrowing the slowdown.
Select a time range
Choose 24h, 7d, or 30d in the page header. Every summary, chart, model breakdown, service breakdown, and trace ranking uses the selected window. Comparison text uses the immediately preceding window of the same length when enough prior data exists.
Use the refresh control to fetch immediately or select an automatic refresh interval while monitoring live traffic.
Read the summary
The top metrics report:
- Total tokens and total calculated cost.
- Average tokens per generation and number of active models.
- Trace count and trace error rate.
- P95 generation latency and active session count.
“No prior baseline” means Lens has current data but cannot calculate a meaningful comparison for the preceding period.
Follow changes over time
The charts separate input and output tokens, trace and generation throughput, failed traces, and P50/P95 generation latency. Use them to identify when a change started before filtering the trace explorer to the same time period.
Find expensive or unreliable activity
Model efficiency groups usage, latency, and reliability by generation model. Service cards compare token load and trace health across instrumented services. The trace rankings highlight token-heavy traces and recent failures that are good starting points for an investigation.
Choose the next view
Open Traces for request-level filtering, or use Sessions and Users when the problem spans multiple requests. If cost is missing or incorrect, review Cost settings.