The trace detail view keeps structure, timing, and data visible together. It is designed for moving from the failing or expensive part of a run to the exact input, output, and metadata that explains it.
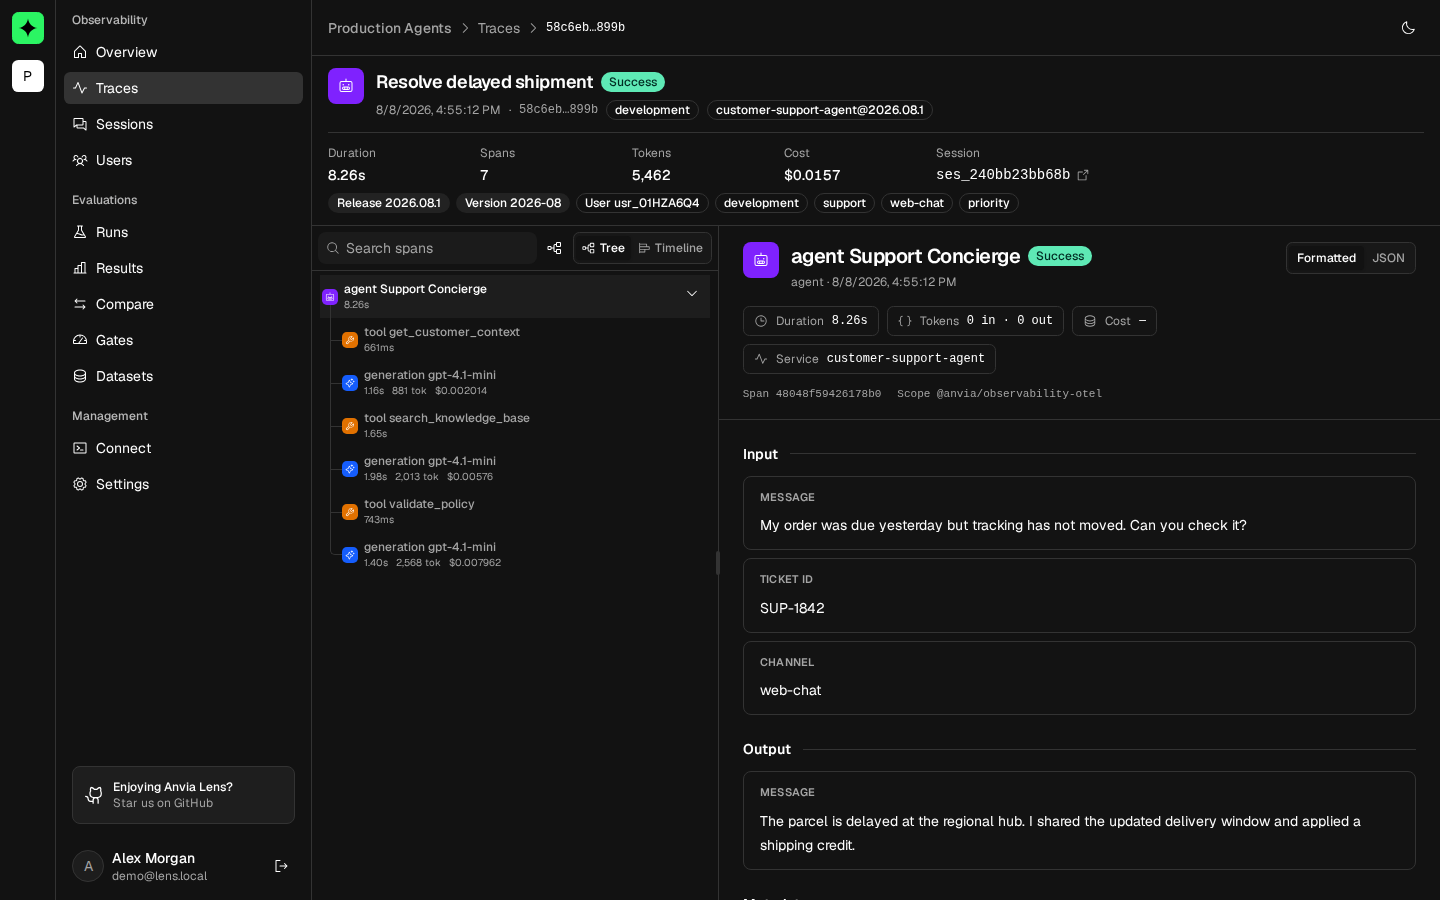
Example: explain a support-agent result
Run pnpm example:anvia:tools, open the printed trace ID, and select get_ticket in the span tree.
Check its input for TICKET-1001, its output for the synthetic high-severity ticket, and its status
and duration. Then select the following model generation to see how the tool result became the
final triage response.
Expected result: the tree shows an agent parent with generation and tool children; selecting a row highlights the same interval in the timeline and opens its payload in the inspector. If payload content is absent in another application, confirm that full capture is allowed and enabled before treating the absence as an instrumentation problem.
Read the trace header
The header identifies the trace by name and ID and summarizes status, start time, duration, span count, token usage, and cost. Project context remains in the application header so the trace cannot be mistaken for data from another project.
Navigate the span tree
The left panel preserves the exported parent-child relationship. Observation glyphs distinguish agents, generations, tools, evaluators, embeddings, retrieval work, and ordinary spans.
- Search spans by name.
- Expand or collapse an individual branch.
- Use the global control to expand or collapse the entire tree.
- Select a row to synchronize the timeline and inspector.
Use the timeline
The timeline positions each observation relative to the full trace. Long bars reveal latency-heavy work; nesting shows which parent operation owned that time. Selecting a bar opens the same span in the inspector.
For a slow trace, select the longest child before optimizing the parent. A long tool span points to the external operation; a long generation span points to model or prompt behavior.
Inspect a span
The inspector shows the selected span status and observation type, then reports duration, tokens, cost, model, and service where available. Span and parent IDs support correlation with raw OpenTelemetry data.
Payload sections include input, output, metadata, and error information. Switch between formatted and raw JSON when message content is easier to read conversationally or exact serialization is important. Copy raw JSON when reproducing an issue.
Payloads are available only when instrumentation captured them. Safe capture, redaction, or an evaluation payload policy may intentionally leave them unavailable.
Move between traces
Return to the explorer without losing its URL-backed filters, or follow links from a session, user, evaluation result, or comparison. Related evaluations attached to the trace provide the quality signal alongside runtime behavior.
Mobile layout
On narrow screens, navigation, timeline, and inspector become tabs. The information is unchanged, but only one panel is visible at a time.